Using Xdebug
Bugs are an inevitability of writing code and so Local Server provides an easy way to enable Xdebug when you need it.
Xdebug is installed but not enabled by default because it can slow PHP down considerably. This could make you less productive depending on the work you're doing.
Activating Xdebug
When you need to run your debug client you can append the option --xdebug to the start command:
composer server --xdebug
Note: you do not need to stop the server first to run the above command.
Deactivating Xdebug
You can start the server again without the --xdebug option at any time to deactivate Xdebug:
composer server
Note that the Xdebug extension will still be installed but it will no longer be active.
Setting the Xdebug Mode
The Xdebug mode settings allows you to change what Xdebug does for a given session. This defaults to debug for step-debugging but can be configured on start up by passing a value to the --xdebug flag like so:
composer server --xdebug=trace
The different modes available are:
develop
Enables Development Aids including the overloadedvar_dump().coverage
Enables Code Coverage Analysis to generate code coverage reports, mainly in combination with PHPUnit.debug
Enables Step Debugging. This can be used to step through your code while it is running, and analyse values of variables.gcstats
Enables Garbage Collection Statistics to collect statistics about PHP's Garbage Collection Mechanism.profile
Enables Profiling, with which you can analyse performance bottlenecks with tools like KCacheGrind.trace
Enables the Function Trace feature, which allows you record every function call, including arguments, variable assignment, and return value that is made during a request to a file.
You can enable multiple modes at the same time by comma separating their identifiers as the value of --xdebug for example --xdebug=develop,trace.
Connecting to Xdebug
Most modern editors will have a built in debug client. Instructions for the following editors are below:
Xdebug is configured to connect to the default port 9003 so there should be a minimum of configuration required in your editor.
VSCode
- Install a PHP Debug extension
- Open the debug tab (the bug icon on the menu sidebar).
- In the dropdown menu at the top of the left hand side bar choose "Add configuration".
- In the popup that appears select "PHP" as your environment.
- You will be taken a new file called
.vscode/launch.jsonwith the default settings:{ "version": "0.2.0", "configurations": [ { "name": "Listen for Xdebug", "type": "php", "request": "launch", "port": 9003 }, { "name": "Launch currently open script", "type": "php", "request": "launch", "program": "${file}", "cwd": "${fileDirname}", "port": 9003 } ] } - Add the following
hostnameandpathMappingsproperty to each configuration:{ "version": "0.2.0", "configurations": [ { "name": "Listen for Xdebug", "type": "php", "request": "launch", "port": 9003, "hostname": "0.0.0.0", "pathMappings": { "/usr/src/app": "${workspaceRoot}" } }, { "name": "Launch currently open script", "type": "php", "request": "launch", "program": "${file}", "cwd": "${fileDirname}", "port": 9003, "hostname": "0.0.0.0", "pathMappings": { "/usr/src/app": "${workspaceRoot}" } } ] } - You are done, click the green play button to start the debug client.
For more information on the available configuration options, including Xdebug settings, view the VSCode Debugging documentation here.
PHPStorm
Local Server takes advantage of PHPStorm's Zero Configuration Debugging. All you need to do is tell it about the server by following these steps:
- Go to Preferences > Languages & Frameworks > PHP > Servers (link opens in PHPStorm).
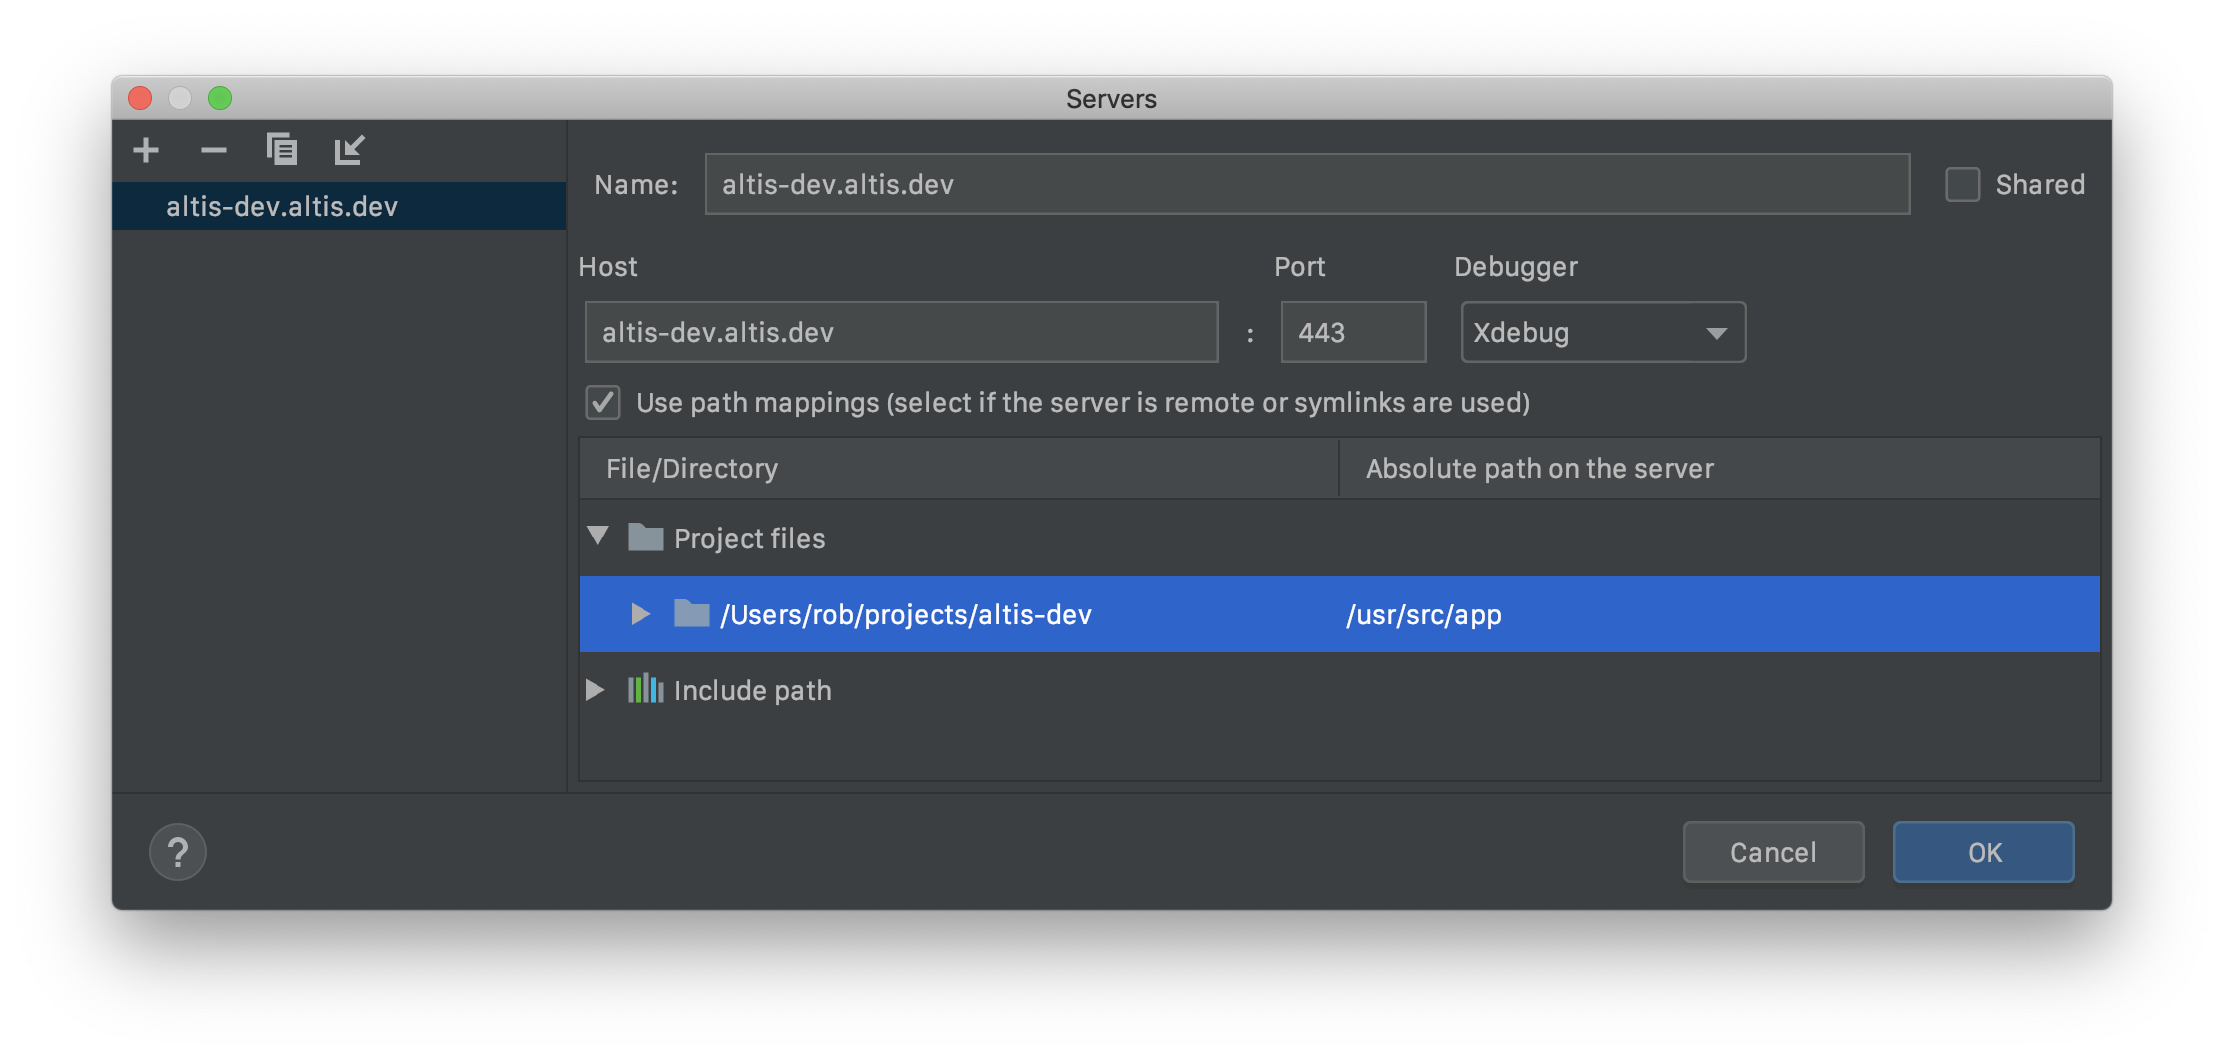
- Click the plus icon and create a new Server entry with the following settings:
- The name should be your project host name:
<my-project>.altis.dev - The host name should also be:
<my-project>.altis.dev - Port:
443 - Check the "Use path mappings" box
- Next to your project's root directory enter
/usr/src/app
- The name should be your project host name:
- Set some breakpoints and click the "Listen for Debug Connections" icon
